Dashboard
The dashboard is your starting page and the first thing you see when you log into the Admin portal. It provides a customizable overview of your most important data and metrics.
Getting Started
When you first log into a new client, the dashboard is typically empty or contains minimal content. You'll need to populate it with widgets from various modules throughout the system.
Adding Widgets to Your Dashboard
Widgets are created from existing views and reports in different modules. Here's how to add them:
- Navigate to any list page (products, promotions, orders, baskets, etc.)
- Create or configure a report with the filters and data you want to display
- Go to Tools and select Create Dashboard
- A new widget will automatically appear on your dashboard
Supported Data Sources
You can create widgets from nearly all list views in Norce Commerce, including:
- Product lists
- Promotion lists
- Order lists
- Basket lists
- Customer lists
- Company lists
Dashboard Examples
Here are some common dashboard configurations:
- Kanban Board: Track products in different stages of completion
- Sales Analytics: Monitor new orders created today, or new customers, best customers
- Recent Activity: View new baskets from the last week
- Campaign Performance: See promotion usage and fulfillment metrics
Customizing Your Dashboard
Editing Mode
To modify your dashboard layout:
- Click the Edit button in the top-right corner
- The Edit button changes to Save and Cancel buttons
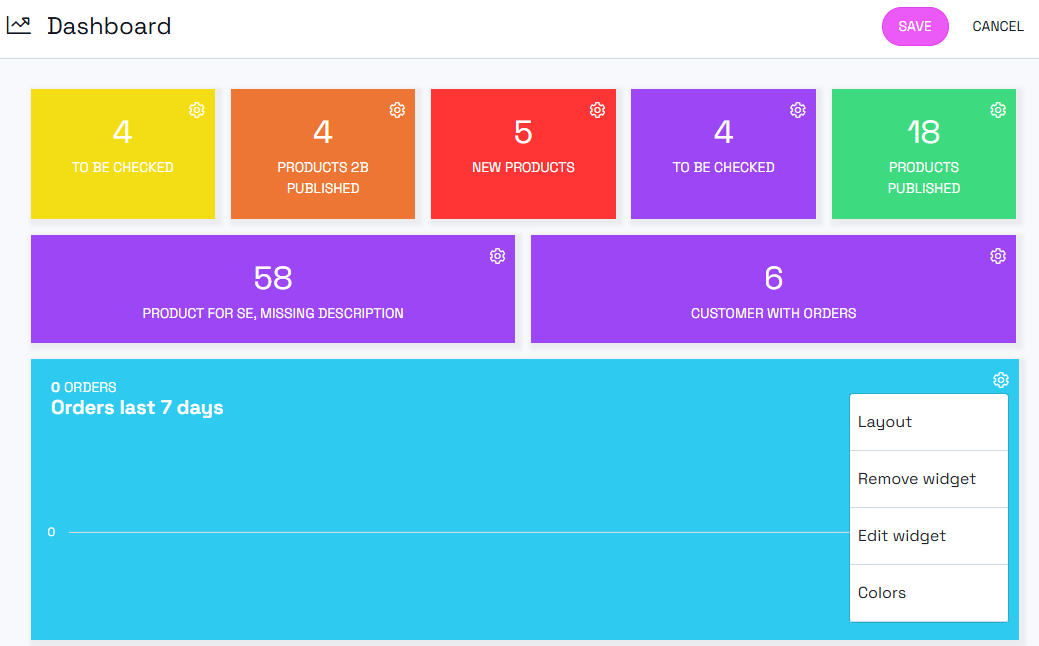
- Each widget displays a cog wheel icon in its top-right corner
Widget Configuration
Click the cog wheel icon on any widget to access options for:
- Remove: Delete the widget from your dashboard
- Edit: Modify widget settings
- Layout: Change how data is displayed
- Colors: Customize the visual appearance (for certain layouts)
Layout Options
Choose from several display formats:
| Layout | Description | Best For |
|---|---|---|
| Table | Shows top 1, or up to 20 items directly in the widget | Best customers today, Top 3 campaigns |
| Graphs (in different styles) | Time-based charts | Orders over time, created baskets over time |
| Total | Single number display | # of products missing description, # of promotions not used |
Layout-Specific Options
- Table Layout: Adjust the number of rows displayed
- Graph Layouts: Customize colors and styling
- Total Layout: Change background colors
Rearranging Widgets
To move widgets around your dashboard:
- Enter edit mode
- Use the drag handle (appears on the left side of each widget)
- Drag and drop widgets to different positions, rows, or columns
Widget Visibility and Permissions
Widget visibility is determined by the source report's "access" level:
- Application: Widget visible only in the specific application for all users
- Private: Widget visible only to you
- Client: Widget visible to all users in your organization on all applications
To set widget visibility, modify the permissions when you create it from the source list.
Current Limitations
- Each user currently has access to one dashboard page
- Widget permissions are set when created and cannot be modified directly on the dashboard